How to Build an SEO Dashboard in Looker Studio
To build an effective SEO dashboard in Looker Studio, start by connecting your key data sources—Search Console, Analytics, and keyword tools—ensuring you have proper permissions and site verification in place. Blend the data to get thorough understandings, then add visualizations like scorecards and trend lines, with filters for keywords, regions, and device types. Automate data refreshes to keep understandings current, and use segmentations to uncover hidden patterns. Stick to these basics—because everyone loves a straightforward playbook—and you’ll uncover how a well-structured dashboard reveals what really drives your SEO.
TLDR
- Connect and verify Search Console, Analytics, and keyword tools with proper permissions and correct property types.
- Use data blending to combine multiple sources for comprehensive SEO insights.
- Create visualizations like scorecards, trend lines, and filters for performance analysis.
- Automate data refreshes and schedule regular updates for real-time accuracy.
- Customize dashboards with filters, date controls, and annotations for targeted, actionable insights.
Why Building an SEO Dashboard in Looker Studio Boosts Your Strategy

Building an SEO dashboard in Looker Studio immediately improves your ability to make data-driven decisions by consolidating all key metrics into one clear, visual interface. These dashboards enhance SEO performance monitoring, offering real-time reporting on search engine metrics like keyword rankings and impressions. Automated updates simplify data visualization, improve stakeholder communication, and help you act swiftly on understanding, avoiding common pitfalls of manual reporting. Additionally, understanding local search strategies can help you identify when traffic isn’t translating into valuable leads, allowing you to realign your efforts effectively. Incorporating safe AI strategies for local SEO ensures your automation remains compliant with search engine guidelines and avoids penalties or spam filters.
Connecting Your Google Search Console, Analytics, and Keyword Tools
Connecting your Search Console, Analytics, and keyword tools in Looker Studio isn’t just about linkages; it’s about ensuring the data flows correctly and reflects reality. You need to verify each connection with proper permissions and choose the right property types—domain versus URL prefix—to avoid skewed understanding. Properly addressing indexing issues helps ensure your data is accurate and complete. Understanding Google Search Console errors is crucial because misinterpreting these can lead to incorrect insights. Miss a step or overlook data blending, and you’ll spend more time fixing mistakes than making strategic decisions, which is a frustrating way to justify your time investment.
Linking Data Sources
Once you’ve decided which data sources you need for your SEO dashboard, the next step is to connect them properly, and this involves selecting the right connectors within Looker Studio. Verify your permissions and authorize access to tools like Search Console, Analytics, or keyword tools. Then, customize data fields and blend data for all-encompassing SEO metrics, ensuring accurate property selection for seamless data integration.
| Data Sources | Connectors | Key Actions |
|---|---|---|
| Google Search Console | Search Console connector | Select property, specify site impression table |
| Google Analytics | Analytics connector | Choose account, property, view |
| Keyword tools | Custom connector | Connect and authorize access |
| Blended Data | Data blending options | Customize fields for all-encompassing dashboards |
Ensuring Data Accuracy
Making certain data accuracy starts with verifying that your foundational tools are correctly set up and communicating properly. You must confirm Search Console verification and Google Analytics integration, validate your data sources, and regularly check for metrics consistency.
Refresh your data frequently, resolve discrepancies, and guarantee tracking code verification. These steps uphold Looker Studio data integrity and keep your SEO dashboard setup reliable and current.
Preparing Your Data Sources for Accurate SEO Tracking
To get your SEO dashboard working accurately, you need to start with the right data sources and make sure they’re set up correctly. Guarantee your website is verified in Search Console and properly connected to Looker Studio for accurate tracking. Use the correct domain property, verify HTTPS, and select relevant data tables. Regularly refresh data to maintain data accuracy and avoid outdated reports. Additionally, streamlining ad units can enhance user experience, which indirectly benefits SEO performance by reducing page load times and improving Core Web Vitals. Monitoring trends and business metrics instead of obsessing over daily ranking movements can provide a clearer picture of your SEO progress over time.
Creating Your First SEO Data Connection and Basic Visualizations
Creating your first SEO data connection in Looker Studio might seem straightforward, but it’s easy to stumble if you’re not careful with your settings. Start by linking Google Search Console, choose the correct property type, and configure the data source to match your domain. Incorporate your SEO keywords and metrics effectively by understanding SEO workflow principles to optimize your visualizations. Once connected, add visualizations like scorecards for SEO metrics and incorporate date range controls for effective SEO performance analysis.
Adding Filters, Date Controls, and Segmentations to Your Dashboard

Adding filters and date controls to your dashboard gives you the power to focus on specific timeframes, campaigns, or segments, making your understanding more actionable and less guesswork.
I’ve seen too many dashboards cluttered with irrelevant data because filters weren’t set up properly, so it’s worth taking the time to configure them thoughtfully.
Just remember, synchronized filters across charts can save you from chasing inconsistent metrics — a mistake I’ve made more than once when setting up complex dashboards.
Implementing Date Range Filters
Implementing date range filters in Looker Studio is a straightforward way to give your SEO dashboard the flexibility it needs for meaningful analysis. Using a date range filter, you can customize the data visualization time period, making your SEO reporting more versatile and relevant.
Position the filter widget prominently to enable real-time data updates and dashboard customization, ensuring your understanding stay current and actionable.
Segmenting Data for Insights
Segmenting your data with filters and controls allows you to peel back layers of your SEO performance and identify what’s really driving results. Using segment filters, date range controls, and visualization filters, you can perform user behavior analysis and traffic segmentation.
Proper filter interactions guarantee understandings update seamlessly, helping you refine keyword filtering and audience segmentation without getting lost in data noise.
Visualizing SEO Metrics With Scatter Plots and Trend Lines

Understanding how your keywords perform across different metrics can be intimidating without the right visual tools, but scatter plots paired with trend lines in Looker Studio make this task manageable.
These visualizations help you analyze SEO metrics, such as ranking analysis and click-through rate, by showing keyword performance and search engine data.
They also reveal patterns, shifts, and opportunities in your keyword analysis efficiently.
Interpreting Visualizations and Automating Updates for Better Insights
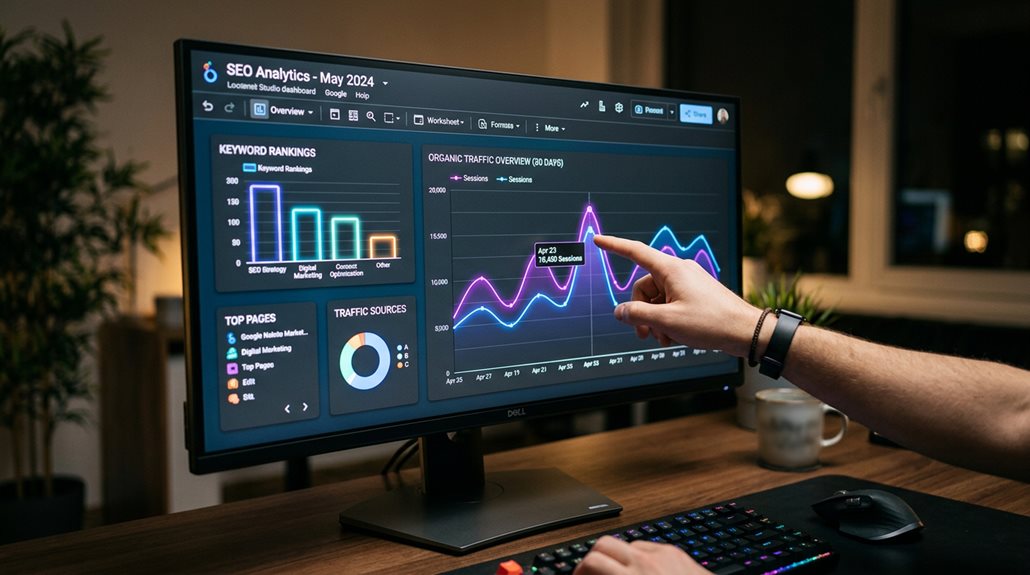
Interpreting your visualizations effectively means focusing on the patterns and fluctuations that matter most—like dips in clicks or sudden jumps in impressions—and understanding what they reveal about your SEO efforts.
Use time series charts, filters, and segments to identify trends. Automating updates with real-time data, annotations, and data thresholds helps you quickly spot issues and refine strategies through clear chart interpretation and trend analysis.
Expanding and Optimizing Your SEO Dashboard for Continuous Improvement
To keep your SEO efforts on track, your dashboard needs to evolve alongside search engine algorithms and your business priorities. Focus on SEO dashboard optimization through continuous improvement, using data blending for a thorough view.
Enhance visualizations, automate data refreshes, and add filter customization for competitor analysis, regions, or devices.
Regularly experiment with new insight discovery methods to stay ahead.
And Finally
Building an SEO dashboard in Looker Studio isn’t magic—it’s about setting up the right data connections, choosing meaningful visualizations, and refining filters to get clear understanding. Focus on what truly matters—traffic trends, keyword performance, and rankings—then automate updates so you’re not chasing stale data. Remember, dashboards should serve your strategy, not complicate it. Keep it simple, stay consistent, and don’t fall for the myth that more data equals better decisions.